
By Dylan Beardsley September 22, 2026
Your venue looks busy. The calendar is full of names. But is it actually earning what it should? A packed calendar and a profitable one aren’t the same. That gap is exactly what the venue utilization rate reveals.
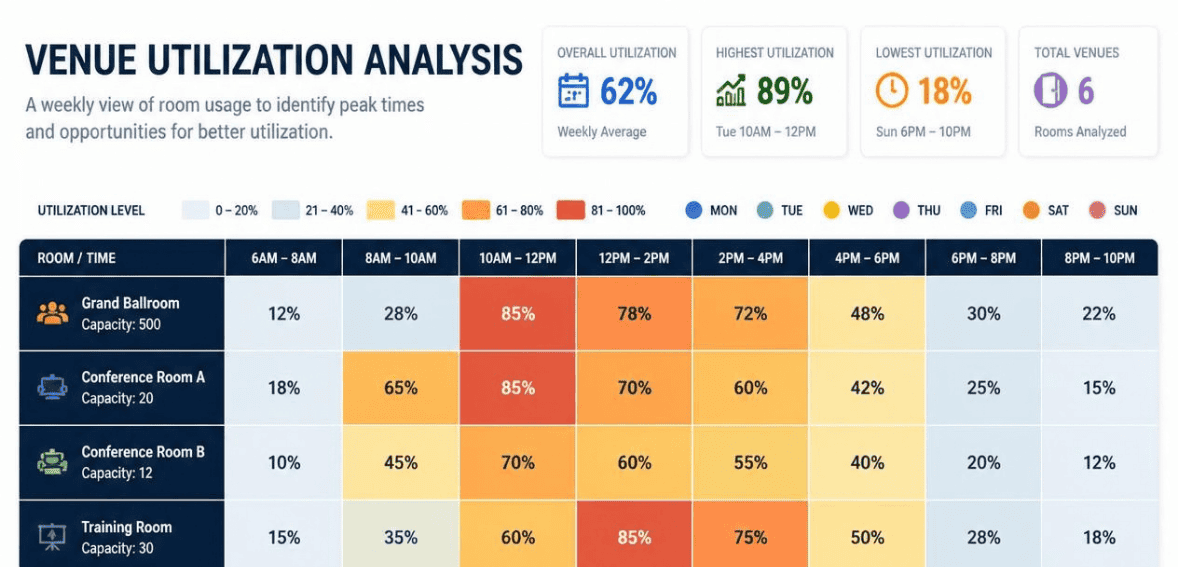
Many venue managers just make educated guesses. They assume weekend business is strong and that Tuesdays are the slowest. Those working assumptions cannot substitute for facts. Identifying the utilization of each individual room in your venue, for every time slot, is the only way to eliminate the guessing and understand the full potential of your space.
The following guide will show you how to do this in simple steps. It’s much simpler than you might think. No finance degree is required. All you need is easily accessible booking data and a few minutes to spare. Without further delay, let’s do this!
What Is Venue Utilization Rate?
Venue utilization rate measures how much of your bookable space is actually being used. It compares the time you sold against the total time you had available to sell. The result is a percentage.
Consider it a score for your physical asset. A high score means your rooms are profitable. A low score means there are empty rooms. Even empty rooms cost you rent, utilities, and wages.
This metric purposely leaves out revenue. It considers only the efficiency in the use of your space. Of course, the quality of revenue matters. However, the utilization metric answers a different question. It tells you if your rooms are booked.
The Basic Venue Utilization Rate Formula
The core formula is refreshingly simple. Here it is:
Venue Utilization Rate (%) = (Total Hours Booked ÷ Total Hours Available) × 100
Say a ballroom is available 12 hours a day. In one day, it gets booked for 6 hours. That is (6 ÷ 12) × 100, which equals 50%. Half the day sat empty.
You can also do the same calculations based on days. Let’s say you have 31 days in October for a single location. You show that 19.5 days were booked for events in total. This would mean that 19.5 days out of 31 days were booked for events in total, which is (19.5 ÷ 31) × 100, nearly 63%. This is the sort of hospitality space booking operational calculations that the event operations community at Umbrex uses to benchmark spaces.
Truthfully, the math is the easiest part. The trick lies in determining the most accurate information to input. You have to first determine your “available hours.” This is the time when you need to be most honest. Are you open for 8 hours or 14 hours? Do you consider setup and teardown time? You have to be consistent.
How to Calculate Venue Utilization by Room
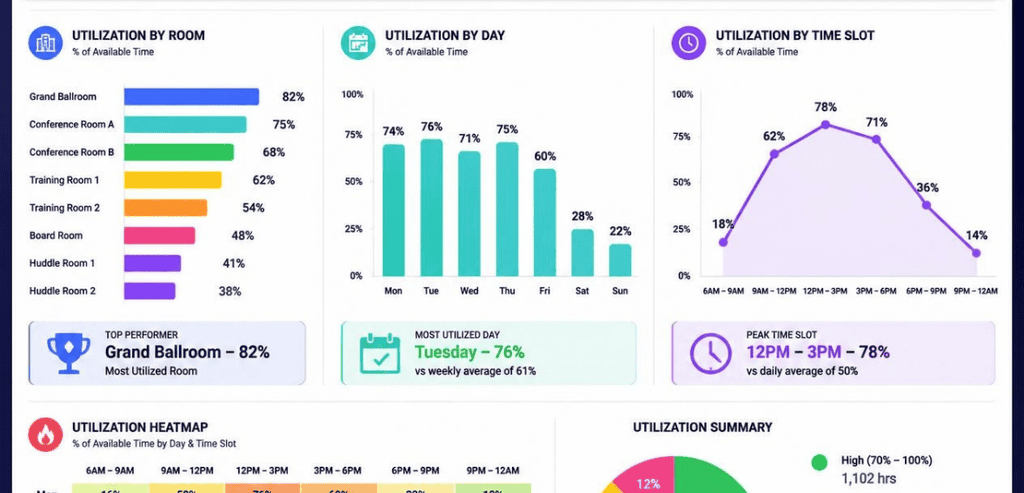
Total utilization hides problems. One superstar room can mask three dead ones. So break the number down by space.
Calculate the occupancy rate for each room individually. Use the total number of hours each room was booked. Divide this by the total number of hours each room was available. Multiply the result by 100 to get the occupancy rate for that room. Repeat this for all the rooms you rent.
Imagine a venue that has three rooms. The main hall has a usage rate of 80%, the mid-sized meeting room has a usage rate of 55% and the small meeting room has a usage rate of 20%. While the blended average would reflect a usage rate of a comfortable 52%, the breakout room is the problem room that is going to give you trouble.
Data at the room level makes a difference. It could be that the meeting room that is not used much needs a price reduction, needs to be filled with better storage, or even needs better images to be placed on your website. You will never know unless you analyze the meeting rooms individually.
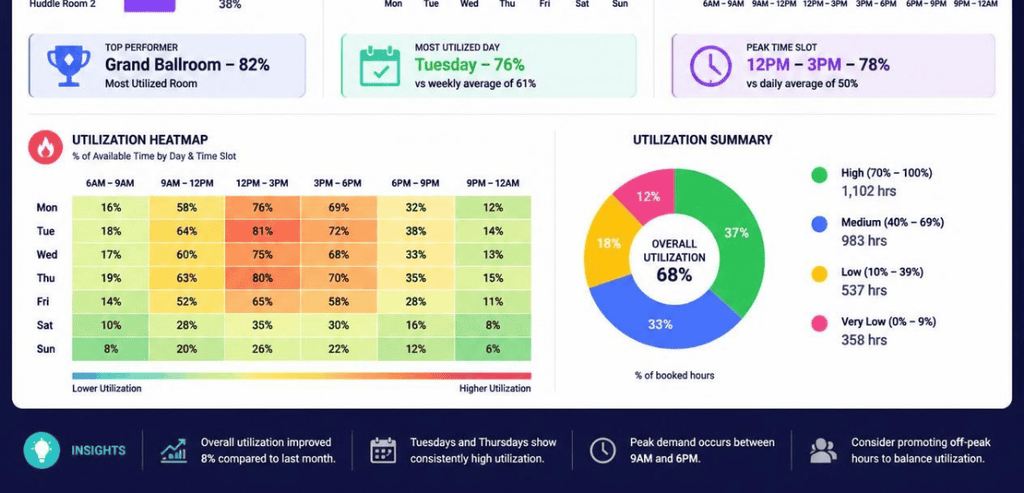
How to Calculate Venue Utilization by Day
Next, slice your data by day of the week. This exposes your demand rhythm.
Group your bookings by weekday. Calculate the venue utilization rate for each one. Monday, Tuesday, Wednesday, and so on. Patterns pop out fast.
Most event spaces follow similar patterns. Weekends get busy with weddings and social events, while days in the middle of the week are relatively empty. However, those underutilized days are your best opportunity.
Daily data can help you with pricing. You can fill high-demand weekend bookings at a premium while getting training sessions and corporate workshops to fill your midweek slots with packages that are priced to sell. This is dynamic pricing, and it raises your overall booking levels.
How to Calculate Venue Utilization by Time Slot
Now go one level deeper. Split each day into time blocks. Morning, afternoon, and evening are common. Some venues use hourly slots instead.
Calculate the utilization for each time slot. A room may be fully booked every evening but may be empty every morning. A day-rate view will not capture that. Time-slot data will capture it.
There is a lot of potential revenue in this scenario. Let’s assume that your evening bookings are at 90% utilization but your morning bookings are at 15% utilization. Those empty morning time slots may be booked for meetings, yoga classes, or photo shoots. Filling the time slots is money in the bank.
Time-block analysis can refine the scheduling process. You can determine the exact time slots throughout the day that show demand. You can choose to be fully staffed at that time, and avoid the cost of staffing a full crew for time slots that show no demand.
Metrics That Add Context to Your Venue Utilization Rate
Utilization is powerful, but it is not the whole story. A booking is not the same as a body in the room. A few companion metrics sharpen the picture.
The occupancy rate considers actual use compared to the agreed use. For example, if a room is booked for four hours and the guest only stays for two hours, the room was booked for the full four, but two were wasted. The measure of occupancy indicates this waste.
The no-show rate is also a consideration. This is calculated by dividing the number of no-shows by the total number of bookings and multiplying by 100. The no-show rate is high if there is a lack of booking discipline, wasting resources and reserving a time that could have been used by someone else.
One of the findings from the meeting-room benchmark study by Worklytics was that no-shows directly and indirectly affect the efficiency of an entire facility.
The space turnover rate indicates how often a room is booked and re-booked in a single day, which is calculated by dividing the number of daily bookings by the total number of spaces available for bookings. Turnover rates that are very low suggest that there are vacant spaces. Extremely high turnover rates indicate that booking events are back-to-back with no allowance for time in between. Consider the rates collectively for all spaces rather than one in isolation compared to the others.
What Counts as a Good Venue Utilization Rate?
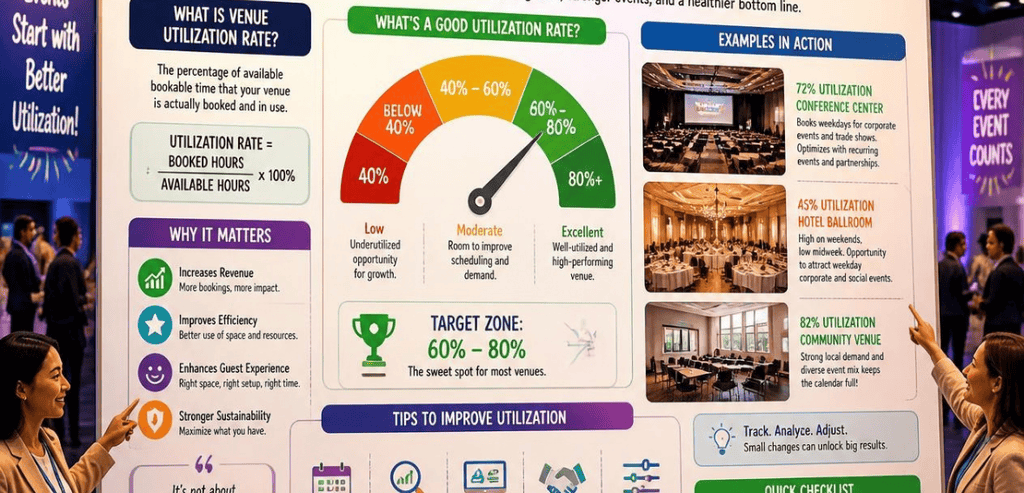
Benchmarks vary by venue type. Context is everything. Still, a few useful targets exist.
For premium, flexible event spaces, hitting 60% utilization is a healthy baseline. Some venues that chase only high-end corporate clients accept 50%. They trade volume for higher revenue per event. That can be a smart tradeoff.
Office and corporate meeting rooms have their own specific set of rules. For workplace teams, the target is to hit the 40% to 60% sweet spot. On their team, Robin says that more than 60% is actually counterproductive. As a team, you have to remember that if the rooms get too full, people are not going to be able to find room to have a space for a quick informal meeting.
Be careful with approaching the limit. Trying to achieve 100% utilization may seem good, but it is actually the opposite. You lose flexibility and staff will get burned out. Even worse, the time it takes to complete tasks drastically increases. Your goal should be achieving a high, but sustainable level of utilization.
Track it weekly, not monthly. By only reviewing it weekly, you are able to catch low utilization levels before the opportunity to fill your team meetings is lost.
Tools That Track Venue Utilization Automatically
Spreadsheets work fine when you start. But manual tracking gets messy fast. Booking software automates the whole process and cuts human error. Here are two worth knowing.
Tripleseat
Tripleseat is designed specifically as an event management system for restaurants, hotels, and unique venues. Its purpose is to simplify high-volume private dining and event management. Tripleseat’s marketing, sales, and distribution modules interface with customers to record sales leads, create event proposals, automate contract generation, and facilitate payment collection.
The primary concern for most customers is the ability to use Tripleseat for reporting. Tripleseat offers the ability to record event bookings and create custom reports to analyze sales, event booking history, and the activity of multiple venues. It allows visualization of peak event booking times and spaces that are underutilized. It helps you make informed marketing and pricing decisions.
Robin
Robin’s analytics emphasize office space and meeting room use. It is better for corporate teams managing hybrid workplaces than for event space. Meeting space utilization is automatic. Robin analyzes data from meeting space calendars and bookings and reservations.
Dashboards display booking information. Robin can tell which meeting rooms are the most popular and which meeting rooms are never used. It can tell when meeting space is reserved but no one shows up. That meeting space time is released for use for other meetings. Meetings with an office element can be difficult to analyze using a spreadsheet.
Tips to Improve Your Venue Utilization Rate
Once you have your numbers, put them to work. A few proven moves lift utilization without adding rooms:
- Use dynamic pricing. Raise rates for prime weekend and evening slots. Discount slow mornings and midweek days to attract new bookings.
- Reduce turnaround time. Faster setup and teardown between events adds bookable hours. More available time can mean more bookings.
- Market your dead slots. Package quiet mornings for meetings, classes, or shoots. Target segments that actually want off-peak time.
- Fix your no-show problem. Send reminders and require deposits. Every no-show is a booked slot that earned nothing.
- Repurpose weak rooms. If a space stays under 25% after real effort, rethink it. New photos, a new rate, or a new use may help.
Small changes compound. Trimming turnaround by 30 minutes per event can free up hours across a busy month.
Conclusion
Your venue is your highest fixed cost. Every hour without bookings eats away at your profit. Tracking venue utilization is the best way to identify this problem and resolve it.
It can be evaluated based on the simple equation of booked hours divided by available hours, times 100. Once you have that percentage, you can divide it three ways. Consider each venue room. Then each day of the week. Then each time slot. The information that you can get from the layered data is more valuable than a single custom report.
You do not need advanced technology to get started. A simple spreadsheet with accurate data will get you far. When your business grows, you can implement solutions such as Tripleseat and Robin to automate this work and discover more insights.
Start measuring this on a weekly basis. The profitability of your business will be impacted by the changes you make based on these insights. Measuring this will help you get closer to the best venue utilization rate tracking system.
Frequently Asked Questions (FAQs)
What is a good venue utilization rate?
For premium event spaces, 60% is a healthy baseline. Venues serving mostly high-end clients may accept 50% because each event earns more. Office meeting rooms usually target 40% to 60%. Rates near 100% are rarely sustainable, since they leave no room for flexibility or turnaround.
How do I calculate venue utilization by time slot?
Split each day into blocks such as morning, afternoon, and evening. For each block, divide the hours booked by the hours available, then multiply by 100. This shows exactly when your space sells and when it sits idle, which day-level data alone cannot reveal.
What is the difference between utilization rate and occupancy rate?
Utilization rate measures how much available time was booked. Occupancy rate measures how much of that booked time was actually used. A room booked for four hours but used for two has high utilization but low occupancy. Track both to spot wasted, paid-for time.
Should I track venue utilization weekly or monthly?
Track it weekly. A monthly view is too slow to act on. Weekly tracking lets you spot soft patches while there is still time to fill open calendar slots with promotions, packages, or targeted outreach.